Graphs Visualization
Advertisement
Orbit Visualization Tool v.2 3
The Orbit Visualization Tool (OVT) is a software for visualization of satellite orbits in the Earth's magnetic field.
Advertisement
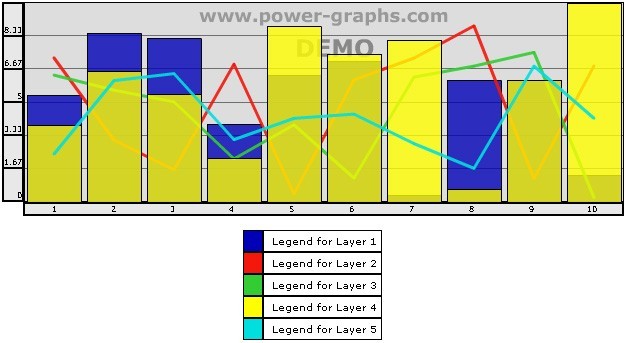


Make Professional looking graphs with Java 3d Graph Software v.9.0
With 1-2-3 PieCharts you can now quickly and easily create professional looking 3d graphs without any of the usual hassle.
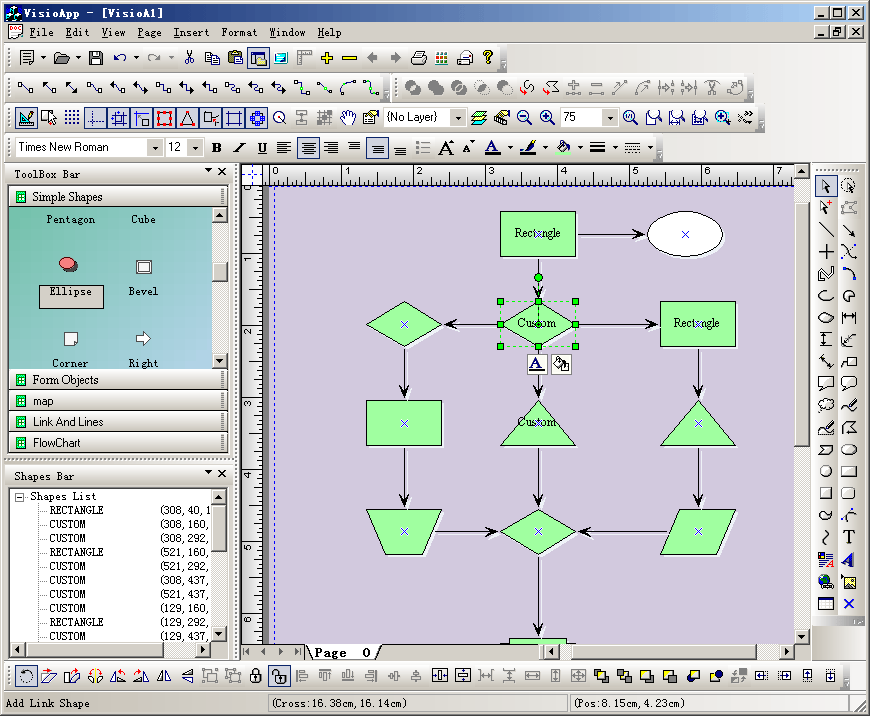
E-XD++ Visualization HMI & CAD ToolKit v.17.02
E-XD++ Visualization ToolKit is an MFC extension library that allows you to create the most advanced user interface in the world.
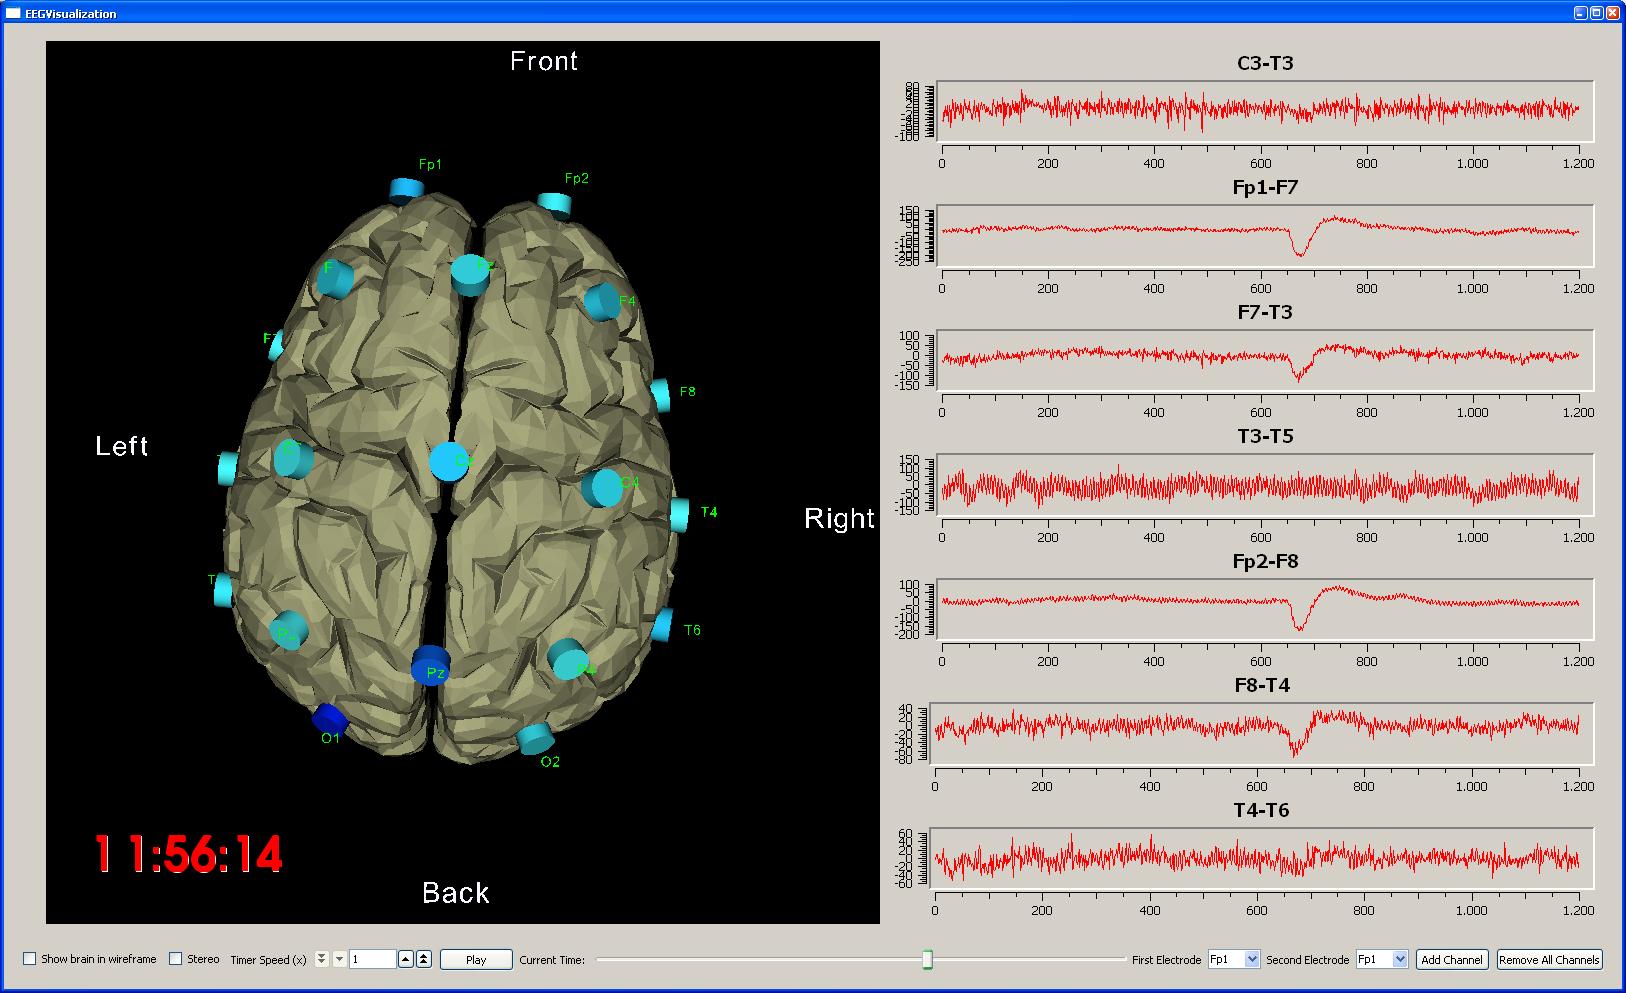
Visualization Toolkit (VTK) v.5.10.0
The Visualization Toolkit (VTK) is an open-source, freely available software system for 3D computer graphics, image processing and visualization.
Music Visualization v.2.0
The program uses internationally patented technology for controlling lighting technology directly by audio signal (LTCA). It can ingeniously control all the lighting technology directly just by music that is being played.
LOYTEC L-Web Visualization v.1. 4. 2001
LWEB Visualization is the graphical user interface in the L-WEB System and provides monitoring and operator functions via Web technologies in building automation.
Interactive Graphs Pack v.2.0
Graphs are helpful when one needs to visually share complex analytical information or when one needs to show the broader trends in the data.
Graphs Made Easy v.3 1
Graphs Made Easy (GME) is an easy way to make great looking graphs in minutes. The traditional approach of spreadsheets and data grids is replaced with simplified data entry. Graphs Made Easy Basic is freeware.
Network Analysis Visualization and v.2. 2. 2001
NAViGaTOR (Network Analysis, Visualization, & Graphing TORonto) is a software package for visualizing and analyzing protein-protein interaction networks.